
Monitoring
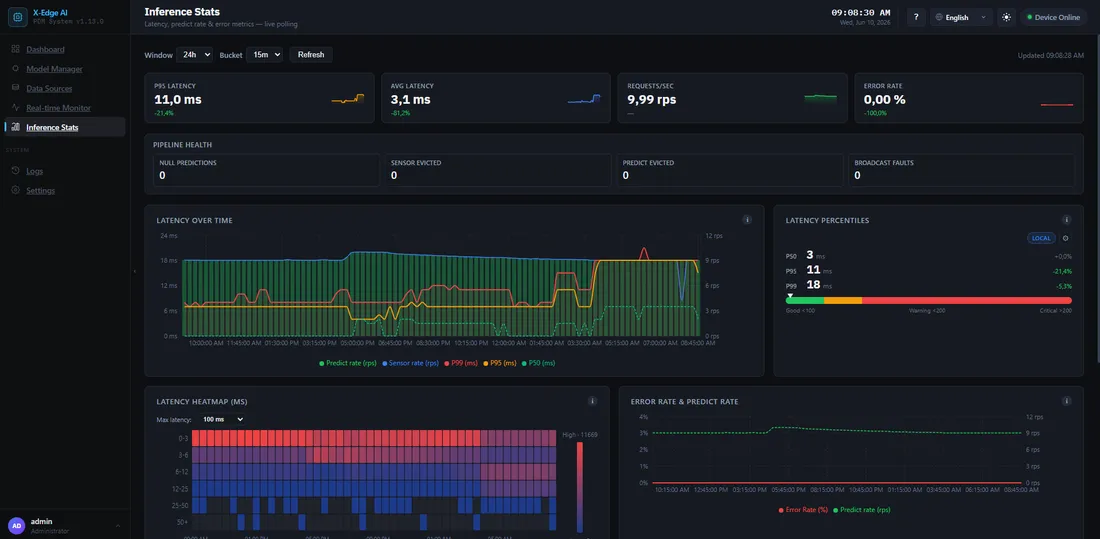
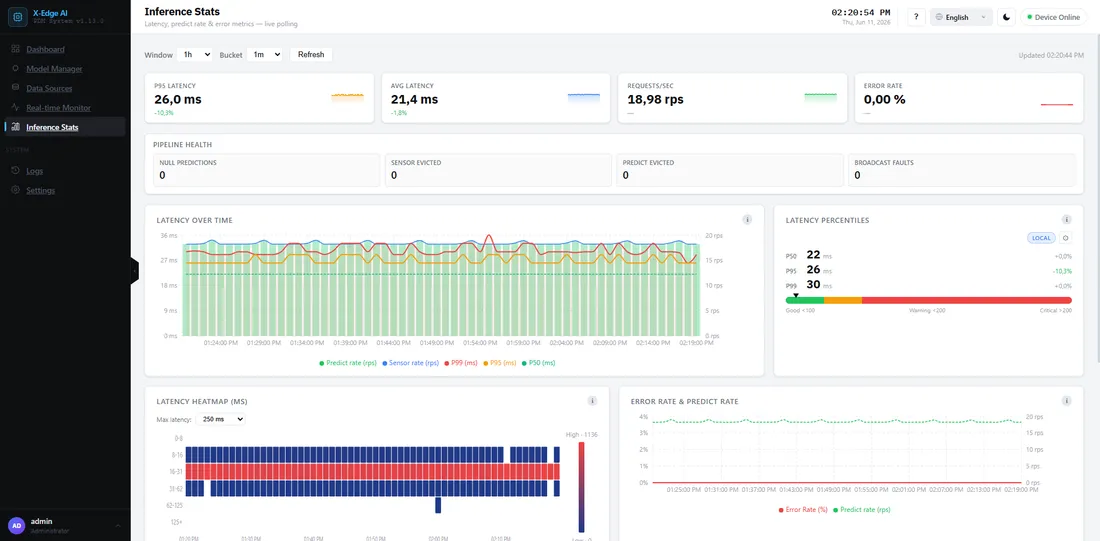
The Inference Stats dashboard shows how your runtime is performing in real time: latency, throughput, error rate, and where time is spent in the pipeline. It updates continuously while a datasource is streaming.
Key indicators
Section titled “Key indicators”- Latency percentiles — p50 / p95 / p99 of end-to-end inference time.
- Throughput — predictions per second.
- Error rate — share of inferences that failed.
- Execution provider — whether inference is running on CUDA (CPU as fallback). A GPU box that falls back to CPU shows up here.
Latency breakdown
Section titled “Latency breakdown”Each inference is decomposed so you can see where time goes:
- Queue wait — time spent waiting in the request queue
- Pre-process — input normalization
- Model exec — pure inference time
- Post-process — output decoding
If latency rises, the breakdown tells you whether the model itself slowed down or the box is saturated upstream.
Window and bucket controls
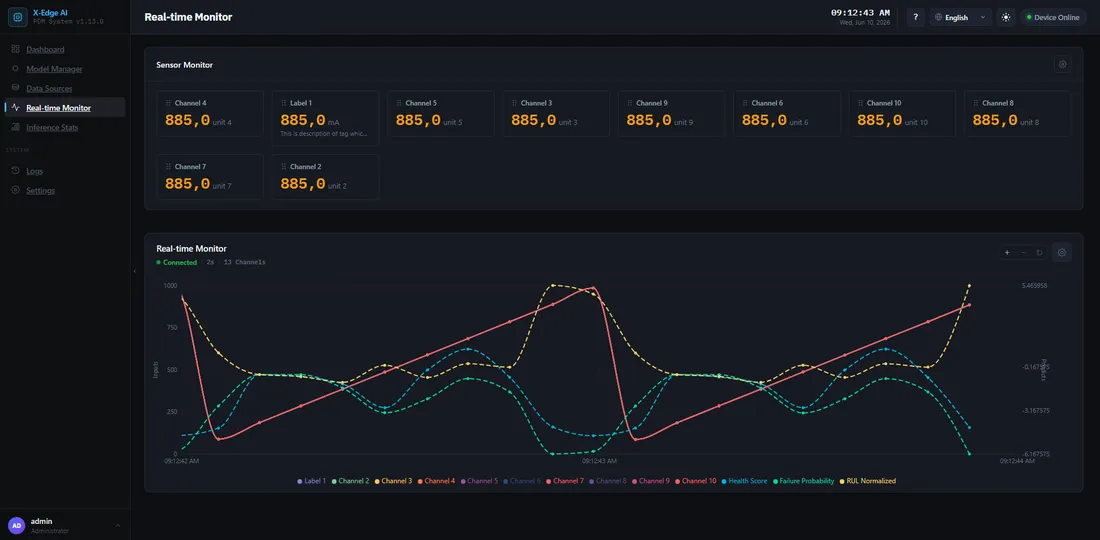
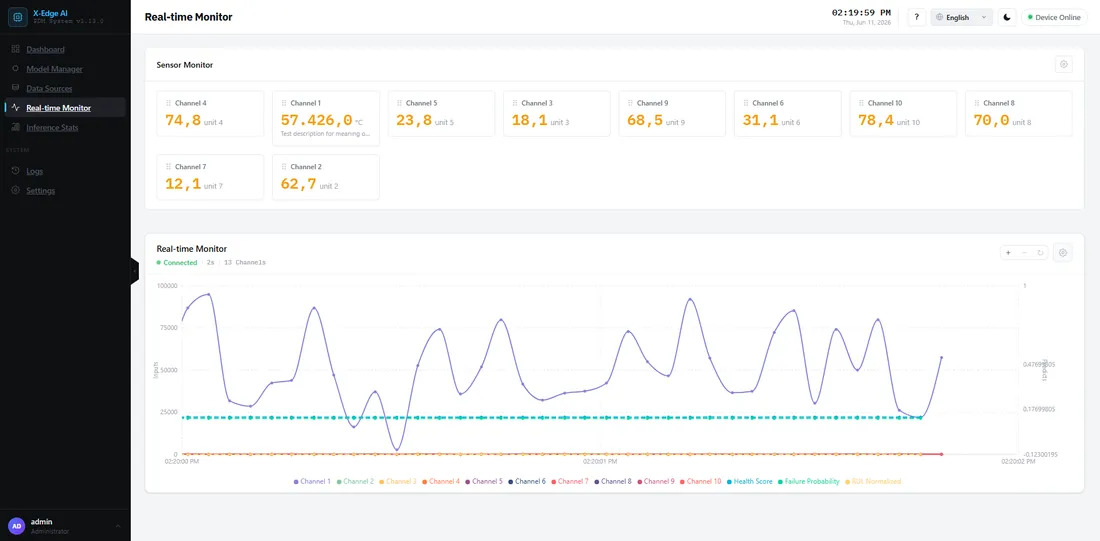
Section titled “Window and bucket controls”Two controls shape the time view:
- Window — how far back you look (for example
5m,1h,24h). - Bucket — how wide each point on the chart is (for example
10s,1m).
The number of points is window ÷ bucket. The dashboard auto-snaps the bucket when
you change the window so charts stay readable — wider windows use wider buckets.
Reading a fresh install
Section titled “Reading a fresh install”If the chart says “no data”, the most common reasons are:
- No flow is streaming yet. Enable a flow, then press Start. Only one flow runs at a time.
- The install is still warming up — wait for the first window of samples.
Health cards
Section titled “Health cards”The System Health Monitor on the Dashboard shows one card each for GPU, CPU, memory, storage and the service. Each card and each row shows a warning or critical status when a reading crosses its threshold. This section covers the memory, storage and GPU memory readings.
Memory Health
Section titled “Memory Health”This card measures the whole machine, not one container.
- RAM — memory in use on the box. The gauge shows the same value.
- Swap — swap in use. On the Jetson, swap is zram: compressed space inside the same RAM.
- Inference — the inference container’s memory, against the memory limit set for that container. If the container reaches its limit, the system stops and restarts it, and inference pauses until it is back.
Storage Health
Section titled “Storage Health”This card measures the disk that holds the database.
- Disk — space used and total size. The gauge shows the percentage used.
- Free — free space in GB.
- Database — the size of the database file.
The status depends on free space, in both percent and GB. A percentage alone misleads on a large disk, and a GB figure alone misleads on a small one. The GB lines leave room for an update: an update takes a database backup and unpacks a new bundle, which together need several GB.
GPU memory
Section titled “GPU memory”The memory row on the GPU Health card is labelled for what it measures:
- Memory (shared with RAM) — the GPU has no memory of its own and uses system RAM. This is the case on the Jetson TX2, so this row and the RAM row on the Memory card read the same memory.
- VRAM — dedicated memory on a separate graphics card.
Thresholds
Section titled “Thresholds”| Reading | Warning | Critical |
|---|---|---|
| RAM | above 80 % | above 90 % |
| Swap | above 75 % | never critical on its own |
| Inference container | above 80 % of its limit | above 90 % of its limit |
| Storage free space | below 15 % or below 10 GB | below 5 % or below 3 GB |
| GPU memory | above 80 % | above 90 % |
What to do
Section titled “What to do”- Memory warning or critical — check the Inference row first. A container that sits near its limit is at risk of being restarted. Look for a model or a Flow that recently changed, and compare with the Inference Stats above.
- Storage warning — check the Database row. If the database is large, see
Disk fills / database grows unbounded.
Each update also keeps a few database backups; see
AIBOARD_BACKUP_KEEPin Environment Variables. - Storage critical — free space before the next update. At this level an update may not have room to finish.
The Logs page streams log lines from the backend and the inference service. Filter by source, level or text, and switch LIVE off to pause the stream.
Lines written while a datasource was being read or written carry context under the message:
- ↓ Name (#id) — the input datasource the line belongs to.
- ↑ Name (#id) — the output datasource the line belongs to.
- #xxxxxxxx — the tick. A tick is one cycle: the input read, the engine call, and each output write.
Datasource names are shown as they were when the line was written.
Click a tick chip to show every line of that tick, from the input read through each output write. Live pauses, so new lines do not push the tick away. A Tick tag appears in the filter bar. Close it, or switch LIVE back on, to return to all lines.
Involuntary stops and restart recovery
Section titled “Involuntary stops and restart recovery”A flow (one input, one model, its outputs) is what you enable, and only one flow runs at a time. To recover from any stop below, fix the cause, toggle the flow off and on, then press Start.
- Inference stopped and no one pressed Stop? Check Notifications. A stop you didn’t request raises a Warning-level alert there instead of failing silently. Causes: someone enabled another flow, deleted the enabled flow, or edited the input datasource it uses while it ran.
- Inference stopped banner. If inference faults while streaming, for example because a tag stops responding, the dashboard shows an Inference stopped banner with the reason. The flow still shows enabled, but its model is unloaded.
- After a backend restart, the enabled flow returns to Ready on its own once the inference service reports healthy. Streaming does not resume by itself. Press Start. If the restore fails, for example because the input can’t connect yet, the flow stays enabled and inference stays idle. Toggle the flow off and on to retry.
- After an inference service restart during streaming, the box restores the flow and resumes streaming on its own. It tries up to three times. If it still can’t, an error notification says inference is stopped.
If something goes wrong
Section titled “If something goes wrong”- Empty charts, unexpected CPU fallback, or rising error rate — see the Troubleshooting runbook.