
Preview Flow
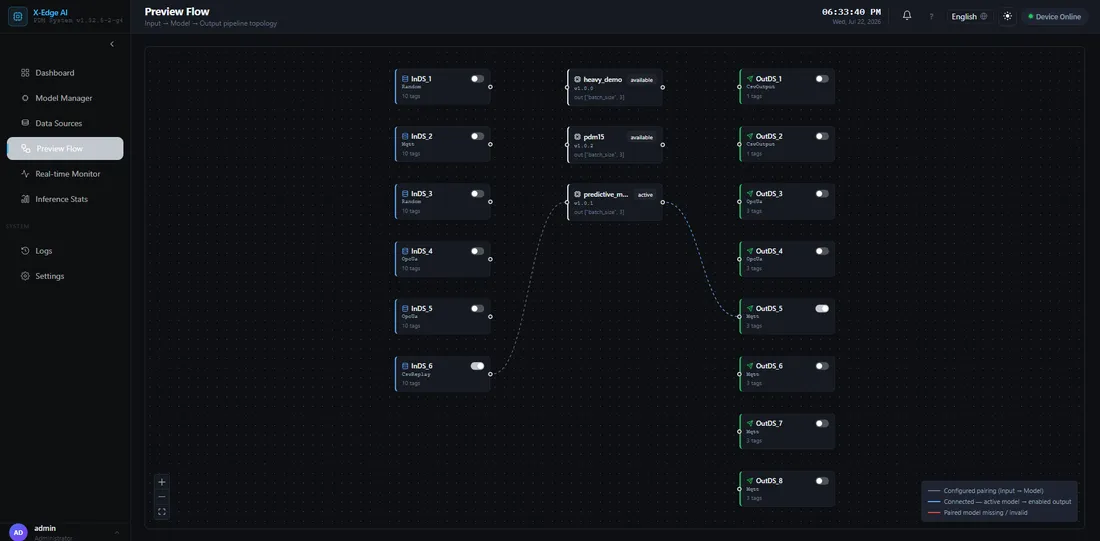
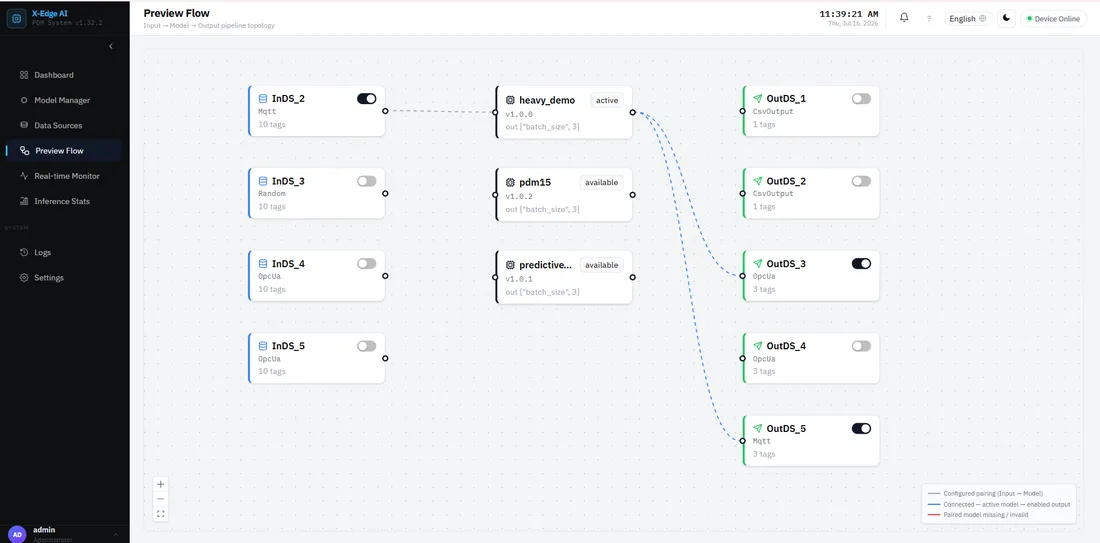
Preview Flow (/preview-flow) is an admin-only, read-only canvas that visualizes
your pipeline as a graph: input datasources on the left, models in the middle, output
datasources on the right. It is only visible to admin accounts — the nav entry and
route are both admin-gated, so a non-admin user is not missing anything if it doesn’t
appear in their sidebar.
The graph is derived live from your existing datasource and model configuration — there is no separate Preview Flow data store, API, or database table. It reflects every flow you have configured, and which one is live.
Each node carries a small type icon and mirrors data you already see elsewhere:
- Input datasource — type, tag count, and the same Enabled/Disabled switch shown on the Data Sources table (read-only here; toggling happens in the drill-in drawer).
- Model — version, status, and output shape (input shape appears in the drill-in drawer, below).
- Output datasource — type, tag count, and its Enabled/Disabled switch.
A model an input references but that no longer exists in the model list renders as a ghost node flagged Missing, rather than being silently dropped.
Edge legend
Section titled “Edge legend”The canvas draws every configured flow, not just the running one. A flow is one Input → Model → Outputs chain, and several flows may read the same input with different models, so one input node can fan out to several models.
What separates them is live: the chain belonging to the enabled flow renders normally, everything else is dimmed with a dashed stroke. Drawing only the enabled flow would hide topology you configured and Task Manager lists.
- Input → Model — one edge per flow. If that flow’s model is missing from the model list, the edge renders red/invalid pointing at a ghost node instead of silently disappearing. An invalid edge stays loud even when dimmed: a dangling model reference is a fault whether or not that flow is the one running.
- Model → Output — one edge per output the flow binds, suppressed when the model cannot actually feed that sink (unparseable or mismatched channel count). An output bound to the enabled flow that nothing can feed is flagged Not connected, so a misconfigured output stays visible instead of quietly doing nothing. An output belonging to no enabled flow is simply dimmed — not live is not a fault.
Live data-flow animation
Section titled “Live data-flow animation”While inference is running, the streaming chain — input → its flow’s model → that model’s connected outputs — animates to give a live “data flow” cue. Every other edge on the canvas stays static. Because inference is a singleton, at most one chain animates at a time: the effect always reflects the one pipeline that is genuinely running, never implies flow through an idle path.
Dimming and animation answer different questions. Dimmed means “not the enabled flow”; animated means “predictions are moving right now”. A flow can be enabled and not animated — that is Ready but not started, which is a valid state, not a fault.
Interacting with a node
Section titled “Interacting with a node”Preview Flow is a viewer, not an editor — you can’t drag nodes or draw new connections. Clicking a node opens the same configuration dialogs you’d reach from the Data Sources or Model Manager pages, in a drill-in drawer:
- Input node — Edit config, Map tags, and a Manage in Task Manager button.
- Output node — Edit config, Map outputs, and a Manage in Task Manager button.
- Model node — a read-only summary (Version, Status, Input shape, Output shape). Model details are read-only here; manage models on the Model Manager page.
Saving any change re-derives the canvas from the updated configuration, so the graph always reflects the current configuration after you close the drawer.
Choosing a model for an input, and enabling or disabling, are done per flow. Several flows can share one input, so the drawer sends you to Task Manager for those instead of acting on a node.
If something goes wrong
Section titled “If something goes wrong”- The canvas shows a flow with a missing or invalid model, or a “not connected” output — fix the flow in Task Manager with a valid model, or match the output’s tag count to the model. See the Troubleshooting runbook.